 A triangle plot is a graphical representation of three variable ratios. Each vertex represents 100% proportion of the variable to its left and 0% proportion of the one to its right. This plot describes the composition of a soil sample and what constitutes its makeup. It is apparent that sand is the majority element in this sample.
Tuesday, September 30, 2008
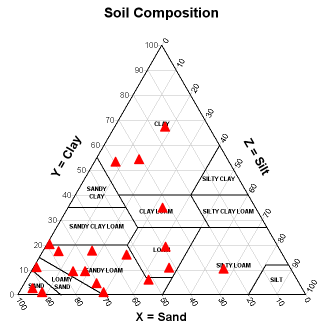
Triangle Plot
A triangle plot is a graphical representation of three variable ratios. Each vertex represents 100% proportion of the variable to its left and 0% proportion of the one to its right. This plot describes the composition of a soil sample and what constitutes its makeup. It is apparent that sand is the majority element in this sample.
Subscribe to:
Post Comments (Atom)

No comments:
Post a Comment