 A parallel coordinate graph plots an entire set of data observations. It does this by displaying all of them on one graph, making it easy to see deviations and/or trends from the average data path. On this graph, it is simple to see the data set that deviates from the others 'flow'; they are the dark green lines that peak at 4.0.
 Friday, October 3, 2008
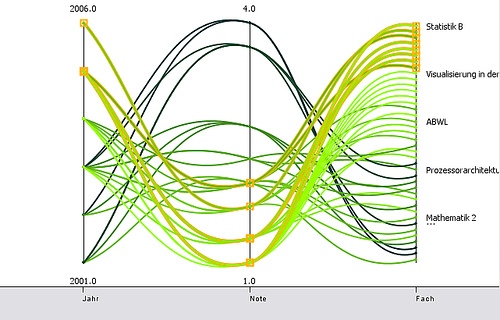
Parallel Coordinate Graph
A parallel coordinate graph plots an entire set of data observations. It does this by displaying all of them on one graph, making it easy to see deviations and/or trends from the average data path. On this graph, it is simple to see the data set that deviates from the others 'flow'; they are the dark green lines that peak at 4.0.
Subscribe to:
Post Comments (Atom)

No comments:
Post a Comment